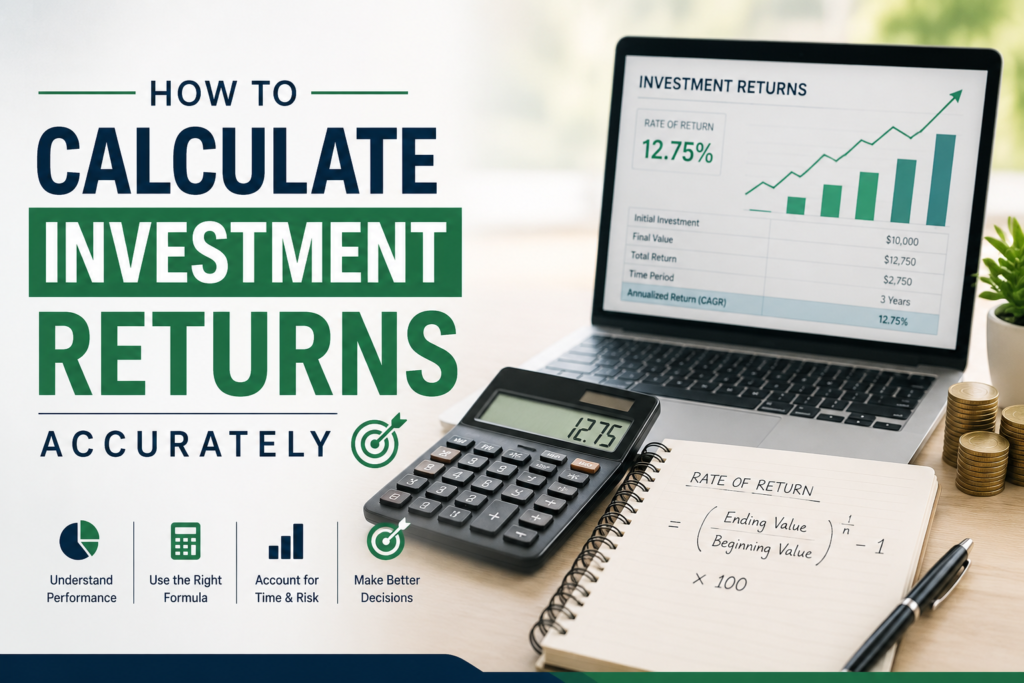
Investing is one of the most reliable ways to build long-term wealth — but most investors track profits, not returns. That single blind spot causes poor decisions, missed goals, and portfolios that look healthy on paper while quietly losing ground to inflation.
Whether you invest in stocks, mutual funds, ETFs, real estate, gold, or retirement accounts like a 401(k) or IRA, knowing how to calculate investment returns accurately gives you the clarity to compare options, measure performance, and plan with confidence.
This guide covers everything — from the basic return formula to CAGR, real vs nominal returns, and how taxes and fees quietly drain your gains over time
What Are Investment Returns?
An investment return is the profit or loss generated by an investment over a specific time period. It answers the question: how efficiently is your money working for you?
Returns are expressed in several ways depending on the context:
- Percentage gain or loss — the most common form
- Annual growth rate — how much you earned per year on average
- Compound annual growth rate (CAGR) — smoothed yearly growth accounting for compounding
- Real return — growth after adjusting for inflation
You invest $10,000 and it grows to $12,500 after two years.
Your total profit: $2,500
Total return = 25%
That 25% looks straightforward — but does it account for inflation? Taxes? How it compares to the S&P 500 over the same period? This guide shows you how to answer all of those questions.
Why Calculating Investment Returns Matters
Beginners often look at account balances and assume they’re on track. Experienced investors measure returns — because a growing balance doesn’t always mean growing wealth.
Key Benefits of Measuring Returns Accurately
1. Set Realistic Financial Goals
If you need $1 million for retirement in 25 years, you need to know what annual return rate makes that possible — and whether your current portfolio is on track.
2. Compare Investment Options on Equal Terms
A mutual fund returning 14% over 3 years versus an ETF returning 10% annually — which is better? Only annualized return calculations tell you accurately.
3. Identify Underperforming Assets
Portfolio review requires understanding whether individual holdings are contributing to — or dragging on — your overall return.
4. Understand Risk-Adjusted Performance
A 20% return with extreme volatility may not be worth more than a steady 12% return. Accurate calculations help evaluate risk vs reward ratios.
Basic Investment Return Formula
The simplest return calculation is absolute return — total gain or loss as a percentage of the original investment.
Initial investment: $5,000
Final value: $6,500
Calculation: (6,500 − 5,000) ÷ 5,000 × 100
= 30% total return
Types of Investment Returns
Different investment scenarios call for different return metrics. Using the wrong one leads to misleading conclusions.
1. Absolute Return
Total gain or loss without considering time. Best for short-term, single-period investments where duration is identical across all options being compared.
- ✅ Simple and easy to understand
- ❌ Cannot accurately compare investments held for different time periods
2. Annualized Return
The average yearly return over a multi-year period. This is what most financial advisors and fund managers report when describing performance.
Where n = number of years
Initial: $10,000 → Final after 5 years: $16,000
Calculation: (16,000 ÷ 10,000)^(1/5) − 1 = 1.6^0.2 − 1
≈ 9.86% per year
3. Time-Weighted Return (TWR)
Used by professional fund managers to measure portfolio performance independent of cash flow timing. Eliminates the distorting effect of deposits and withdrawals, making it the standard for comparing fund managers fairly.
4. Money-Weighted Return (MWR / IRR)
Accounts for when money was added or withdrawn from the portfolio. Better reflects the actual investor experience — how your specific deposit and withdrawal decisions affected your personal return.
| Return Type | Best Used For | Accounts for Time? | Accounts for Cash Flows? |
|---|---|---|---|
| Absolute Return | Short-term, same-duration comparisons | No | No |
| Annualized Return | Multi-year performance comparison | Yes | No |
| CAGR | Long-term growth analysis | Yes | No |
| Time-Weighted Return | Evaluating fund managers | Yes | Eliminates effect |
| Money-Weighted Return | Personal portfolio performance | Yes | Yes |
CAGR: The Gold Standard Investment Metric
Compound Annual Growth Rate (CAGR) is the most widely used investment performance metric in finance. It represents the smoothed annual growth rate of an investment, assuming profits are reinvested each year — which is how most real investments work.
Where n = number of years held
Why CAGR Is Better Than Simple Average Return
Suppose an investment gains 50% in year one and loses 33% in year two. The simple average is +8.5%. But the actual result is breakeven ($100 → $150 → $100). CAGR correctly shows 0% growth.
Purchased property for: $200,000
Sold 8 years later for: $340,000
CAGR = (340,000 ÷ 200,000)^(1/8) − 1 = 1.7^0.125 − 1
≈ 6.85% per year
How to Use CAGR for Investment Comparisons
CAGR lets you compare investments on equal footing regardless of different holding periods:
- Stock A held for 3 years: CAGR of 18%
- Mutual fund held for 7 years: CAGR of 11%
- Real estate held for 12 years: CAGR of 7%
Without CAGR, these three investments would be nearly impossible to compare meaningfully. With it, the stock clearly led — but you can also factor in risk and liquidity to make a fully informed judgment.
Understanding Compound Growth
Compound growth is the single most powerful force in long-term investing. Albert Einstein reportedly called compound interest the “eighth wonder of the world” — and the math backs it up.
Instead of earning returns only on your original investment, compounding means you earn returns on previous returns as well. The longer your investment horizon, the more dramatic the effect.
Compound Interest Formula
A = Future value of investment
P = Principal (initial investment)
r = Annual interest rate (decimal)
n = Number of compounding periods per year
t = Number of years
Invest $10,000 at 10% annually
After 10 years: $25,937
After 20 years: $67,275
After 30 years: $174,494 — that’s 17x your original investment
Why Starting Early Matters More Than Amount Invested
Consider two investors, both targeting retirement at age 65:
| Investor | Start Age | Monthly Investment | Total Invested | Portfolio at 65 (8% return) |
|---|---|---|---|---|
| Early Emily | 25 | $300 | $144,000 | $1,006,000 |
| Late Larry | 40 | $600 | $180,000 | $397,000 |
Emily invests less money total but ends up with more than twice the wealth — purely because time gave compounding room to work. This is why financial advisors consistently emphasize starting investments as early as possible.
Real Return vs Nominal Return
One of the most overlooked aspects of investment return calculations is inflation. Your nominal return is what your account balance shows. Your real return is what your money can actually buy.
Nominal Return
The raw percentage gain before any inflation adjustment. When someone says “my portfolio returned 12% last year,” that’s the nominal return.
Real Return
The purchasing power gain after inflation is accounted for. This is what actually matters for your financial wellbeing.
Nominal investment return: 11%
Annual inflation rate: 4%
Real return = (1.11 ÷ 1.04) − 1
≈ 6.73% real purchasing power gain
When Inflation Beats Your Returns
If your savings account pays 2% annually and inflation runs at 3.5%, your real return is negative. You’re losing purchasing power even though your balance is technically growing. This is why cash sitting in low-yield savings accounts is often considered a slow loss over long time periods.
How Taxes and Fees Affect Investment Returns
Two factors silently drain investment returns that most investors underestimate: capital gains taxes and investment fees. Together they can reduce a 12% return to 8% — or worse.
After-Tax Return Calculation
Investment return: 15%
Capital gains tax rate: 22%
After-tax return = 15% × (1 − 0.22)
= 11.7% net return
US Capital Gains Tax Rates (2026)
| Holding Period | Tax Type | Rate (Single Filer) |
|---|---|---|
| Under 1 year | Short-term capital gains | 10% – 37% (ordinary income rate) |
| Over 1 year | Long-term capital gains | 0%, 15%, or 20% |
| Qualified dividends | Long-term rate applies | 0%, 15%, or 20% |
The Hidden Cost of Investment Fees
Investment fees — brokerage commissions, mutual fund expense ratios, advisory fees, and management charges — compound against you just as returns compound for you.
| Scenario | Gross Return | Annual Fee | Net Return | $100K After 30 Years |
|---|---|---|---|---|
| Low-cost index fund | 10% | 0.05% | 9.95% | $1,728,000 |
| Actively managed fund | 10% | 1.0% | 9.0% | $1,327,000 |
| High-fee fund | 10% | 2.0% | 8.0% | $1,006,000 |
A 2% fee difference costs you over $722,000 on a $100,000 investment over 30 years. This is why fee minimization is a cornerstone of long-term investing strategy.
Common Investment Return Calculation Mistakes
Mistake 1: Comparing Absolute Returns Across Different Time Periods
A hedge fund claiming “40% returns” sounds impressive — until you learn that’s over 4 years, meaning roughly 8.8% per year. An index fund showing 35% over 3 years beats it at 10.5% annually. Always annualize before comparing.
Mistake 2: Ignoring Inflation in Long-Term Planning
A retirement projection built on nominal returns will overestimate your future purchasing power. Use real returns (nominal minus inflation) for any goal 10+ years away.
Mistake 3: Using Average Return Instead of CAGR
Average return is mathematically misleading for volatile investments. If a fund gains 100% and then loses 50%, the average is 25% — but you’re back to where you started. CAGR shows the truth: 0% growth.
Mistake 4: Forgetting Dividend Reinvestment
Total return includes dividend income, not just price appreciation. The S&P 500’s price-only return since 1960 is roughly 6.5% annually — but total return including reinvested dividends exceeds 10%. Ignoring dividends understates performance significantly.
Mistake 5: Calculating Returns Before Taxes
Pre-tax returns don’t reflect what you actually keep. Tax-advantaged accounts (401k, IRA, Roth IRA) change the net return equation dramatically — another reason account type selection matters as much as investment selection.
How to Compare Different Investments
Standardized return metrics make it possible to evaluate radically different investment types — stocks, bonds, real estate, gold — on equal terms.
Step-by-Step Investment Comparison Framework
- Calculate CAGR for each investment over the same period
- Adjust for inflation using the real return formula
- Subtract taxes based on holding period and account type
- Account for fees (expense ratios, management costs, transaction costs)
- Assess risk using standard deviation or maximum drawdown
- Compare risk-adjusted returns — Sharpe ratio is commonly used
Tips to Improve Long-Term Investment Returns
1. Start Investing as Early as Possible
Time in the market is the most reliable return amplifier available to individual investors. Even modest contributions in your 20s can outgrow aggressive investing started in your 40s — as the compounding table above shows.
2. Minimize Investment Fees
Shift toward low-cost index funds and ETFs where possible. Vanguard, Fidelity, and Schwab all offer index funds with expense ratios below 0.10%. Over decades, the savings are enormous.
3. Maximize Tax-Advantaged Accounts First
In the USA, contribute to your 401(k) up to the employer match (that’s an instant 50–100% return), then max out an IRA or Roth IRA before investing in taxable accounts. The tax savings compound over time.
4. Reinvest All Dividends and Distributions
Dividend reinvestment turns income into compounding growth. Most brokerage platforms offer automatic dividend reinvestment (DRIP) at no cost.
5. Diversify Across Asset Classes
Diversification reduces portfolio volatility without necessarily sacrificing returns. A mix of US stocks, international stocks, bonds, and real estate investment trusts (REITs) smooths out single-market risks.
6. Avoid Emotional Investing
Studies consistently show that individual investors underperform the very funds they invest in — because they buy high during market euphoria and sell low during corrections. A disciplined buy-and-hold strategy beats timing the market for most investors.
7. Review and Rebalance Annually
Portfolio drift — when one asset class grows disproportionately — increases risk over time. Annual rebalancing maintains your target allocation and often forces the discipline of buying low and selling high.